
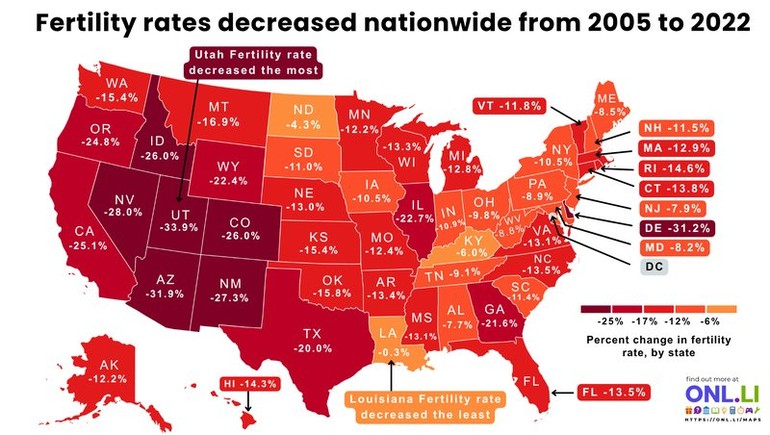
America's fertility rate has been declining for decades, but this map reveals that the trend has not been uniform across the country. Comparing 2005 and 2022, every state recorded a decrease in fertility, although the magnitude of that decline varies considerably. The map illustrates how demographic change has affected every region, from the Northeast to the Mountain West.
The sharpest declines occurred across much of the western United States. Utah, long known for having one of the nation's highest fertility rates, experienced the largest percentage decrease during the period. States such as Nevada, Arizona, New Mexico, Colorado, and Idaho also saw substantial declines, reflecting broader shifts in family size, housing costs, education, and the age at which people choose to have children.
By comparison, some states experienced much smaller changes. Louisiana recorded the smallest decline, while Kentucky, Alabama, and several neighboring states also showed relatively modest decreases. Although birth rates have fallen nationwide, regional differences highlight how local economic conditions, cultural factors, migration patterns, and access to childcare can influence demographic trends.
One particularly interesting aspect of this map is Utah's position. Despite experiencing the largest percentage decline, Utah still ranks among the states with the highest fertility rates in the country. The map highlights how a state can undergo a significant decrease while continuing to have a relatively high birth rate compared with the national average.