
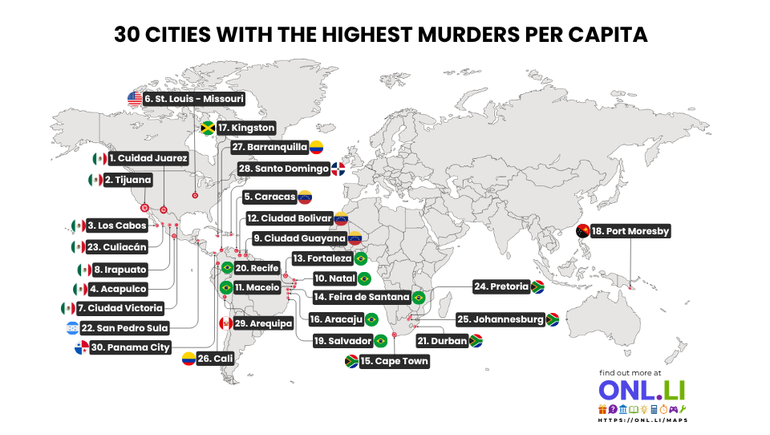
The map highlights 30 cities reported as having some of the highest murder rates per capita. Rather than ranking cities by the total number of killings, the comparison measures murders relative to population size.
This distinction matters because a smaller city may record fewer murders overall but still have a higher per-capita rate than a much larger metropolitan area.
Latin America Dominates the Ranking
Most of the cities shown are located in Latin America, particularly in Mexico, Brazil, Venezuela, Colombia, and the Caribbean.
Mexico has the largest presence on the map. Its listed cities include:
- Ciudad Juárez
- Tijuana
- Los Cabos
- Acapulco
- Ciudad Victoria
- Irapuato
- Culiacán
Several of these cities have experienced violence connected to organized crime, territorial disputes, drug trafficking, and conflicts between criminal groups. However, conditions can vary considerably between neighborhoods and can change from year to year.
Venezuelan Cities Rank Near the Top
Caracas appears fifth on the map, while Ciudad Bolívar and Ciudad Guayana are also included.
Venezuela has faced prolonged economic instability, weakened public institutions, and high levels of armed crime. These factors have contributed to serious security problems in some urban areas.
At the same time, national crime statistics can be difficult to compare because reporting systems, definitions, and data availability differ across countries.
Brazil Has Several Cities on the List
Brazil is represented by Recife, Maceió, Fortaleza, Natal, Feira de Santana, Aracaju, and Salvador.
The concentration of Brazilian cities reflects the country’s long-running struggle with gang violence, illegal weapons, inequality, and competition over drug markets. Some northeastern cities have recorded especially high homicide rates during certain periods.
Brazil’s large population and major regional differences mean that national averages do not always show what is happening at the city level.
South Africa Also Has a Strong Presence
Four South African cities appear on the map:
- Pretoria
- Johannesburg
- Durban
- Cape Town
Violent crime in South Africa is influenced by several overlapping issues, including inequality, unemployment, gang activity, limited policing resources, and the widespread availability of firearms.
Cape Town, in particular, has experienced intense gang-related violence in some communities, even though many other parts of the city remain major residential and tourism areas.
Other Cities Included
The map also identifies cities from several other countries and regions:
- St. Louis, United States
- Kingston, Jamaica
- Barranquilla and Cali, Colombia
- Santo Domingo, Dominican Republic
- Port Moresby, Papua New Guinea
- Arequipa, Peru
- Panama City, Panama
St. Louis is the only city from the United States shown. Its placement illustrates how a city can rank highly per capita despite having fewer total murders than much larger cities.
What “Per Capita” Means
A murder rate is commonly calculated as the number of murders per 100,000 residents.
For example, a city with 100 murders and a population of 500,000 would have a murder rate of 20 per 100,000 people. A city with 200 murders and a population of five million would have a much lower rate of four per 100,000.
Per-capita measurements make it easier to compare places of different sizes, but they can also make smaller cities appear more volatile. A relatively small change in the number of murders may cause a noticeable shift in the rate.
Why Rankings Should Be Read Carefully
Crime rankings are highly dependent on the year, source, city boundaries, and quality of reporting. Some lists use municipal populations, while others use wider metropolitan areas. This can significantly affect the result.
Definitions of murder and homicide may also differ between countries. In some places, incomplete reporting or weak recordkeeping can make official numbers less reliable.
The map does not display a year or the exact murder rate for each city, so it should be viewed as a general comparison rather than a current or definitive ranking.
A Complex Global Issue
The cities on the map come from different political, economic, and cultural settings, but many face similar pressures. Organized crime, inequality, unemployment, weak institutions, firearms, and limited public services are frequently associated with high levels of lethal violence.
Still, a citywide ranking does not mean every district is equally dangerous. Violence is often concentrated in specific neighborhoods, and crime levels may improve or worsen over time.
Understanding these rankings requires more than looking at city names. Population data, local conditions, reporting methods, and the year of measurement all play an important role in explaining what the numbers actually mean.